Your login details were just used to start NGEN Markets from another browser!
Click on Stay to log out anyone else logged in as and return you to the application.
Click on logout to leave the application and let the other browser continue.
Stay
Logout
X
Drag me using this bar Resize me as required
Welcome to NGEN Markets
NGEN MARKETS PREMIUM
TOOLS
Market Close Updated! Click to refresh
Powered by NGEN
Version:
Your Sub
KNOWLEDGE
SHARE LINKS
SETTINGS
FULL SCREEN
VIDEOS
UPDATES
FAVORITES
LOGOUT
MARKETS
NEWS
INSIGHTS
NGEN PRO
FUNDS
COMPARE
CLIENTS
PORTFOLIOS
MY SECURITIES
OVERVIEW
STOCKS
Market Wrap?
Refresh
Large Cap
Mid Cap
Small Cap
Sectors:
Your Watchlists:
Click on a stock to see further details. Click on header to sort up/down.
Manage Columns
Show Stocks based on sort
Download this tableDownload all data for all stocks
No results! try changing your filters above...
Connecting to Equity Data Servers ... Please wait
Last Update
Stock
Sector
Market Cap
Latest
Latest Change(%)
x
x
Stock Name
Getting Intraday data...
Getting Daily data...
Portfolios is only available to Premium Users.
Check out our subscription options here
What is the Portfolios Section about?
> Run full strength analytics on portfolios of Mututal Funds, Stocks and custom securities
> Create and test ideas for model portfolios
> Easily investigate underlying security expsoures of equity and debt securities
> Run contribution, correlations, rolling return, rolling vol, scenario and beta analysis on portfolios
> Compare portfolios side-by-side
> Send portfolio PDFs and interactive live portfolio share links to clients
No Portfolios
Only My Portfolios
Shared With You
You dont have any portfolios yet!
Select one of your portfolios from the menu or Create a new one
Upload Options
Load ISINs from Excel
Load Statement Analyser
Count
Clear All
Rescale to 100%
Equally Allocate
Select assets individually above or upload a portfolio
in Folder:
CREATE
SAVE AS NEW
UPDATE
RUN
DELETE THIS PORTFOLIO
CANCEL
Edit/Save As
STRATEGY TEMPLATES
FINANCIAL PLANNING
RISK PROFILING
You currently do not have access to NGEN PRO features. Please Upgrade to get access.
You have full access to NGEN Pro features!
A selection of 100% automated portfolios created from fixed algorithms targeting various investment styles. Use these templates and edit them to create your own strategies. The research team at NGEN will update strategy weights in the first week of every month.
Back to Strategies
Please note that these are not Mutual Fund recommendations from NGEN Markets. These are algorithmically generated portfolios which can serve as templates for users to create their own portfolios based on their own research.
Send your clients five simple questions through WhatsApp and use their responses to create a risk score. Their responses will be saved here and you can print a full report anytime. This score can also be used to suggest tailored portfolios.
Please note that this is an algorithmically generated risk profiling system created to help advisors understand their clients' risk appetite. We strongly suggest that this should be used in conjunction with your own assessment of your client's needs.
RUN A RISK ASSESSMENT
Not Set
WhatsApp confirmation of risk assessment completion will be sent to this number.
CREATE YOUR URL
This is your permanent risk assessment link. Works on all platforms, but best used on a phone.
Send this link in a WhatsApp message to your client, asking them to complete a quick risk assessment.
YOUR SAVED CLIENT RISK ASSESSMENTS
Risk Assessment links are unique to users. Showing results from all users in your organisation.
CLIENT
PAN
SUBMITTED
RISK SCORE
Use this section to plan your investments by checking future possibilities based on various probabilistic algorithms. Enter your goals, investment and portfolio parameters and hit RUN to check results.
Please note that these financial projections are purely mathematical in nature and are intended to illustrate potential outcomes. They should not be relied upon as actual forecasts, as future results may vary significantly.
You currently do not have access to Health Check
STATEMENT ANALYSER
MONTHLY SIP
Please select a fund to add
Your saved lists ()
Fund Name
Transaction date
Units (+Buy or -Sell)
Transaction NAV
Investment Value
Current NAV
Current Value
Gain/Loss (Rs.)
Absolute Returns (%)
Annualised Return (%)
OR
OR
Funds is only available to Lite and Premium Users.
Check out our subscription options here
What is the Funds Section about?
> Complete screening and filters on the entire Mutual Fund universe in India
> Analyse and compare all SEBI category averages
> Deep analysis of Mutual Fund holdings using individual stocks as well as sectors
> Investigate how Mutual Fund holdings change over time
> Check New Fund Offerrings
Screen
Query
Category Averages
AMC
Holdings Analysis
Reports
New Fund Offers
Due to new anti-spamming regulations by Microsoft, we are suspending automatic emails with reports. These reports will still be available here and generated on a daily basis.
You can subscribe to automatic emails which include these reports, sent to your registered email address (which is the same as your NGEN Markets login). These reports are sent out at around 9 am on every working day.
Your Email:
You can change your registered email in Settings
You can subscribe to the following Reports:
You can download the following historical reports:
Please note that the report date refers to the date that it was generated. The 'As of Date' of data for each fund is listed separately within the report.
SECTOR CHANGES
STOCK CHANGES
EQUITY HOLDINGS
DEBT HOLDINGS
Click on individual cells to drill down. Click column headers (dates) to sort
Can take up to 10 seconds...
Can take up to 10 seconds...
X
Check Funds with Asset Class:
Check Funds with SEBI Category:
Clear
Filter Holding Types
Selected
Value (Rupees invested in crores)
Percentage (Average sector holding)
Click on individual cells to drill down. Click column headers (dates) to sort
Please note that retrieving this data can take up to 20 or 30 seconds.
If you get a message saying Page Unresponsive, please click on Wait.
Check Funds with Asset Class:
Show only
stocks
Show Fund Counts
Shares (Shares held in lakhs)
Value (Rupees invested in crores)
Percentage (Average holding)
Select Holding Type:
Available Sector/Categories:
Top 25 Stocks Held by Open-ended Funds (Click to load)
This search only contains equities that appear in Mutual Fund holdings
Ignore ETFs and Index funds
Click Column headers to sort ascending/descending
Scheme Name
Holding (%)
Fund AUM
Holding (Cr.)
1M
6M
1Y
Mutual funds, like securities investments, are subject to market and other risks. As with any investments in securities, the NAV of units can go up or down depending on the factors and forces affecting capital markets. Past performance may or may not be sustained in the future. Please read all documents carefully before investing.
Search company name or ISIN - This search only contains debt securities that appear in Fund holdings
SEARCH
Enter a search term to look through debt security names and find funds that hold those securities
Click Column headers to sort ascending/descending
Scheme Name
Security
Rating
Holding (%)
Fund AUM
Holding (Cr.)
1M
6M
1Y
Showing Current Category Averages of growth funds. Click on a category to see individual funds. These are the averages of the latest stats for funds in each category. To check Historical Category Averages, please click the chart icon for any category below.
Select Plan:
ALL
Show Asset Classes:
Equity
Debt
Hybrid
Solution Oriented
Other
Download Category Averages
Showing All AMCs with total AUM and average of all return statistics.
Consider Asset Classes:
All
Equity
Debt
Hybrid
Solution Oriented
Other
Totals
Averages
AMC
Launch
AUM
Primary Funds
ngenFS (avg)
MTD
YTD
1Y
2Y
4Y
5Y
7Y
10Y
15Y
Getting Results...
Download NFOs in excel
Click headers to sort.
Funds in lightblue may be available for Analytics - click to run them.
Fund data from AMCs (eg: AUM, PE, PB etc.) for new funds may not be immediately available.
AMC
FUND
Launch
Closing
Asset Class
Category
Min. Inv.
Offer Price
X
X
No categories selected. Showing Everything!
X
Select All
No AMCs selected. Showing all AMCs.
Loading ... please wait
NO RESULTS! TRY CHANGING YOUR OPTIONS ABOVE...
Getting Results...
MAIN SELECTION
FILTER CATEGORIES (0)
FILTER AMC (0)
APPLY FILTERS
Min. AUM:
Fund Plan:
Min. Age:
Min. Sharpe:
Min.
Return:
%
Min. 95% Hist VaR:
%
Show Top:
Data As of:
APPLY
CLEAR
SORT RESULTS
Sort by:
Sort Order:
EXPORT OPTIONS
Toggle Top
Add Top 50 to Compare
Pre-set column views:
APPLY
Save this view:
Saved Column Views:
Returns over one-year are shown annualised. Showing only funds that are live this year.
Scheme Name
Scheme Name
LOADING QUERY...
Build Your Query
Load Example Query
RESET QUERY
SAVE THIS QUERY
LOAD SAVED QUERY
Select Plan:
Select Statistic Filter:
that
Min: , Max:
From:
To:
Add Condition
0 Funds found
No Conditions
Reset Brackets
Show Funds
Check Results
Fund Name
Asset Class
Category
Compare is only available to Lite and Premium Users.
Check out our subscription options here
What is the Compare Section about?
> Instantly compare funds, stocks, indices, category averages and more
> Compare two portfolios side-by-side
> Run comparitive rolling analysis with flexible parameters
> Check largest drawdowns of several securities side by side
> Run yearly analysis, risk vs. return, correlations on several securities together
> Point-to-point analysis of up to five time periods across all securities in your list
> Download all data in Excel or print a professional and editable comparison PowerPoint report that is ready to go
COMPARE SECURITIES
COMPARE PORTFOLIOS
Please wait...
x
OPTIONS
Loading...
RESET
CONVERT TO PORTFOLIO
ADD SECURITY
ADD OTHER ITEMS
ADD GROUPS
ADD PORTFOLIOS & SECURITIES
EXPORT OPTIONS
MAIN LIST
ROLLING
DRAWDOWNS
CALENDAR YEARS
CALENDAR MONTHS
MONTHLY SIP
RISK vs. RETURN
POSITION OVERLAP
CORRELATIONS
CHARTS
POINT TO POINT
BULK DOWNLOAD
Click below to Download the latest holdings of all Mutual Funds in the current list
This can take 5 to 10 seconds...
empty
Installment:
Start Date:
End Date:
RUN SIPs
Earliest allowed start date will set to the latest start date across all Mutual Funds and Indices in this list
Security
Invested Value
XIRR
Final Value
Security
Calculate over different dates...
GO
Start and End dates will be limited to the minimum common period across the items in this list
Show Data Labels on chart
Return Columns
!
Custom Start Date!
Relative Returns?
Benchmark:
Start Date:
Annualise less than 1Y periods?
<
ngenFS
RetFS
RiskFS
Name
Category
Age (yrs)
AUM Cr.
TER
Price
Cum!
CAGR
St. Dev.
Sharpe
Sortino
VaR
MTD
YTD
1D
5D
1M!
3M!
6M!
1Y
2Y
3Y
5Y
7Y
10Y
15Y
Cum Excess
Ann Excess
Beta
Tr Err
Inf Ratio
Corr
Up Cap.
Down Cap.
Eq %
Shorts %
Net Eq %
Debt %
Other %
# holdings
Largecap %
Midcap %
Smallcap %
Other %
P/E
P/B
Net YTM
YTM
Av. Mat
Dur
SOV %
AAA %
AA %
A %
Other
Show overlaps greater than
RUN
RESET
Overlapping Positions (Total: )
This shows minimum common holdings across ALL these funds
No positions common across all funds
Total Overlap Matrix
This shows the total overlap for each pair of funds. Hover over any number to check which pair. Click on a number to see details of that overlap.
0-20%
20-40%
40-60%
60%-80%
80%-100%
Loading Charts... please wait Loading many series in a chart can take a while...
Chart over different dates...
GO
Start and End dates will be limited to the minimum common period across the items in this list
Showing up to the last 24 calendar months returns in reverse time order.
Please note that these are calendar month returns, which means that the number of trading days for each month is not uniform.
Click on column headers to sort. Click again to sort the other way.
Chart view
Table view
Lump Sum Investment Value
?
CAGR
?
Absolute
Dates will be saved
Security Name
Hold on a second!
Calculating rolling returns...
Rolling Window:
Start Date:
End Date:
Methodology:
Statistic:
RUN
Name
Avg
Vol
High
Low
Range
+ve %
Rolling returns distribution
To
To
To
To
To
Weighted Prob. Return
Remainder
Shows worst drawdowns for each fund since inception. You can check individual drawdowns for any item by clicking on the chart icon.
Length and Recovery are shown in number of working days (Mon-Fri).
You can sort these results by Drawdown size, length or recovery days by clicking on the column headers.
Start date cannot be before the start of the minimum common period across all items in the current compare list.
You need a NGEN Markets PREMIUM subscription to access this section.
Subscription & Users
Your Details
Security
Application Settings
Colours
RTA Connections
Report Disclaimers
Full Name:
This is your login name that is displayed in PDF reports, Powerpoint exports and share links.
Email:
This is your username to log in to NGEN Markets. Any reports will also be delivered here.
You cannot change this online. To change your username, please write to support@ngenresearch.com.
Phone Number:
Test WhatsApp
Your Phone Number may be used to send important updated on WhatsApp.
Organisation:
This is your organisation name. It may be printed on some PDF reports and Powerpoint exports.
UPDATE DETAILS
You can use a customised disclaimer for your PowerPoint and PDF reports. This disclaimer will apply to all logins within your organisation.
This will be printed on a new page for all PowerPoint and PDF reports generated for portfolio and Mutual Fund analytics.
Please note that the Market Wrap will not include this disclaimer.
Please avoid special characters in the disclaimers.
The standard disclaimer will be used by default.
Insert an editable standard disclaimer
Clear all text
No custom disclaimer saved
SAVE
Please update once for every ARN you want to connect to NGEN. Please note:
1. We update your latest client holdings only and not transactions.
2. We order your Karvy files once a week (if you have provided credentials) and CAMS files once every two days. If you do not want to share you Karvy credentials, please order the files yourself using these instructions exactly.
4. All client data is erased on every update and replaced with new data.
5. You must have an auto forward set up for CAMS and Karvy files to rta@ngenresearch.com. Please drop us a line at support@ngenresearch.com to get this done.
Link Not Set
Generate 1-click login link
Your one click login link. Please keep this confidential.
You can change your password below.
Please use alphabets and numbers only and a minimum of eight characters. No special characters please. Enter your new password twice below and hit enter.
Your can review your recent logins below:
Date/Time
Action
Your can review devices below that have accessed NGEN Markets using your login. If you see more devices than you use, please write to support@ngenresearch.com.
Unique Device ID
Last Accessed
Your login level:
Get PRO!
You subscription ends on:
X
Your subscription expires in:
days
Your Annual Renewal:
Total payable (incl. GST):
PAY NOW
Important Information
1. Your new expiry date will be updated in a few hours after your payment is confirmed.
2. Your receipt, including GST details, will be sent to your email soon afterwards.
3. For any issues, please write to support@ngenresearch.com
Users in your organisation ():You do not have access to edit these details!
User Name
Email (used to login)
Expiry Date
Active
Admin
Show RTA
Please note that changes to your colour settings will apply to all users within your Organisation, and not just your user account.
Base Colour
Select Colour
CHANGE
RESET
It is reccomended that you use a darker base colour to ensure that all text is clearly visible.
This colour will be applied to the application header, most line and column charts which are single-toned and PDF line separators.
Chart Colour Theme
These colours will be applied to all charts that are multi-toned. For single-toned chart colours, please change your base colour.
Current Theme (you can change individual colours)
Update
Preset Theme 1
Apply
Preset Theme 2
Apply
Preset Theme 3 (Default)
Apply
The settings below are saved for your user account. Changes made here will persist after you have logged out.
GENERAL
Search only Growth Funds
When selected, the Mutual Fund search box at the top of the application will only look through Growth funds to make finding specific funds easier.
Markets Section Default Exchange
BSENSE
The selected exchange will load for sectors and Large, Mid and Small cap indices by default in the Markets section.
Default PDF Password
SAVE
This password will be filled in automatically for any Mutual Fund or Portfolio PDF reports you generate. You can still edit this default password before creating the PDF.
SINGLE SECURITY ANALYTICS
Default Start Date for Single Security Analytics
Fund and Stock Analytics will start from this date on the first load, or later, depending on the start date of the security.
Default Mutual Fund Equity Market Cap Exposures
Mutual Fund Analytics will load this option as default when showing equity market cap exposures.
Default Mutual Fund Debt Exposures
Mutual Fund Analytics will load this option as default when showing debt ratings and sector exposures.
PORTFOLIO ANALYTICS
Rescale Historical Weights
When selected, the default setting for 'Weight Rescale' will load as your selection.
Default Start Date for Portfolio Analytics
Portfolio Analytics will start from this date on the first load, or later, depending on the start date of the security.
Default Portfolio Market Cap Exposures
Portfolio Analytics will load this option as default when showing equity market cap exposures.
Default Portfolio Debt Exposures
Portfolio Analytics will load this option as default when showing debt rating and sector exposures.
My Securities is only available to Premium Users.
Check out our subscription options here
What is the My Securities Section about?
> Create your own securities with just a date and price series
> Save and maintain your own security master
> Add your securities to any portfolios in the Portfolio Section
> Compare these securities to other Funds and Indices in Funds->Compare
> Perfect for dealing with non-standard securities like PMS, AIF, Real Estate or anything else.
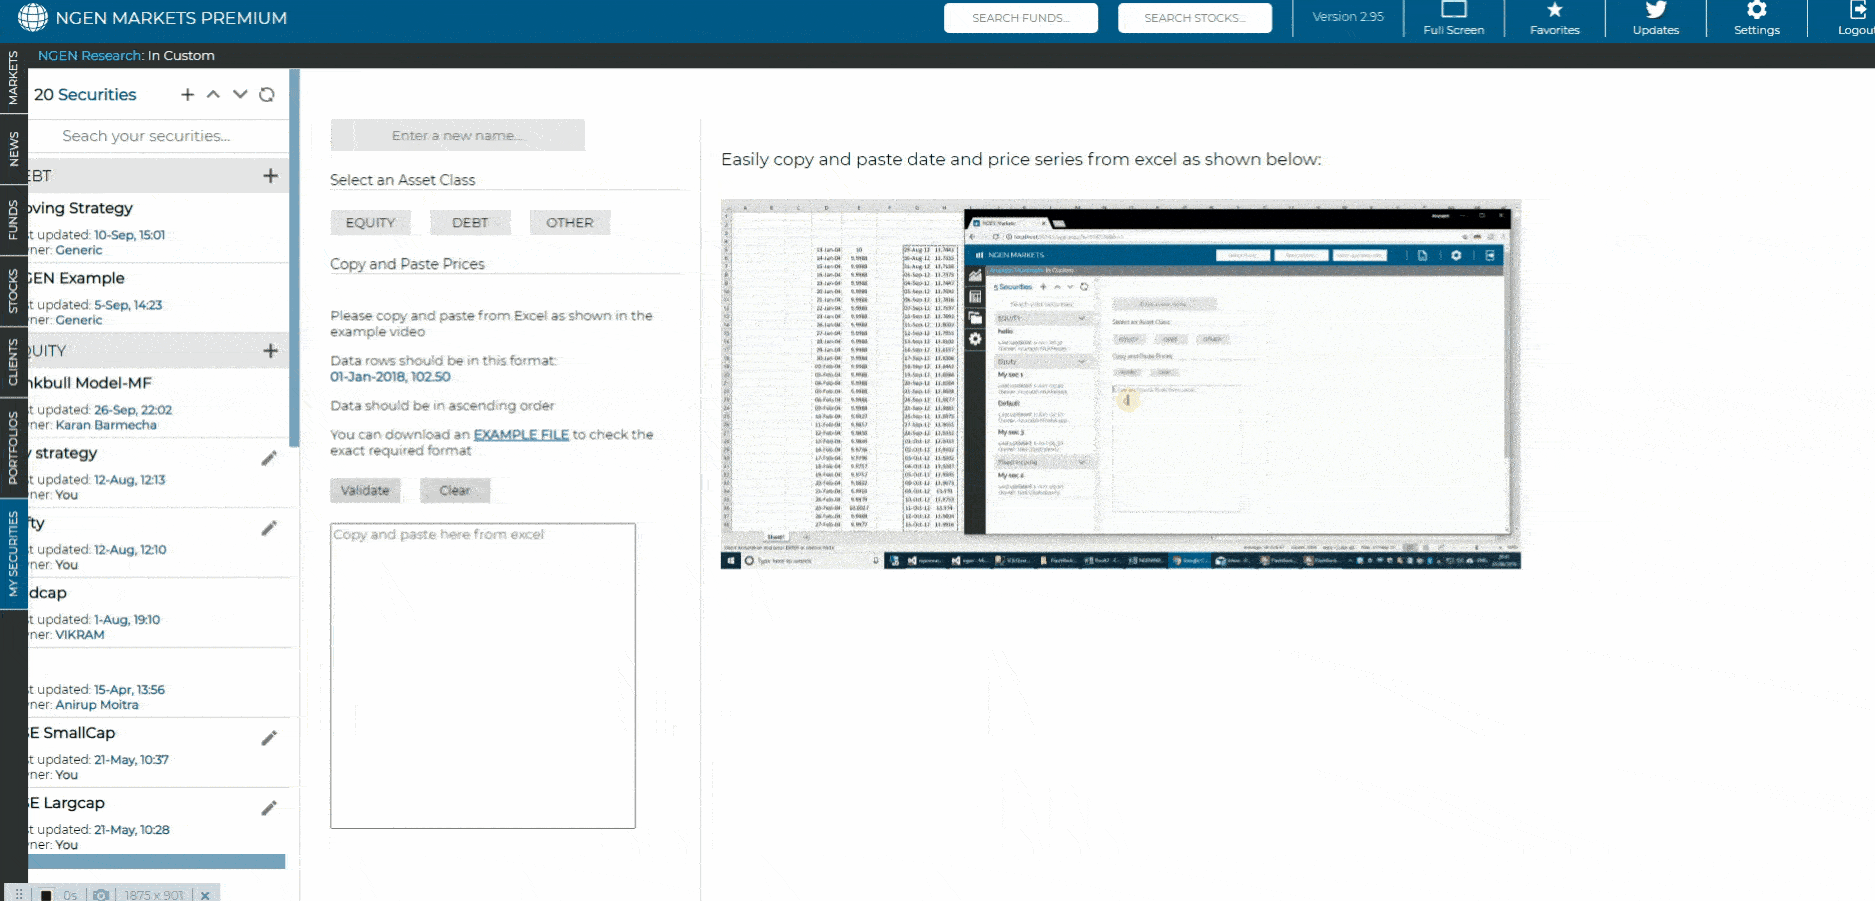
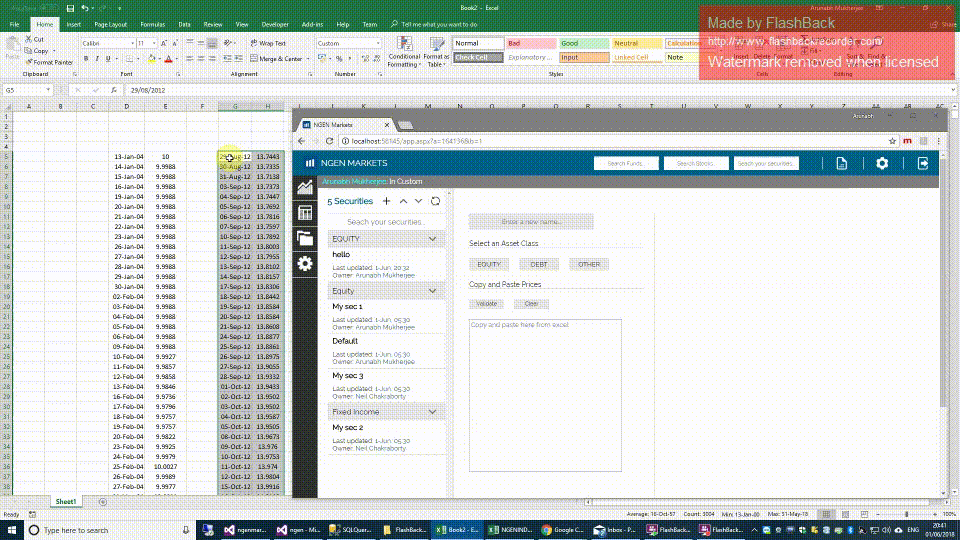
Securities
You dont have any securities yet!
Select an Asset Class
EQUITY
DEBT
OTHER
Copy and Paste Prices
Please copy and paste from Excel as shown in the example video
Data rows should be in this format: 01-Jan-2018, 102.50
Data should be in ascending order
You can download an EXAMPLE FILE to check the exact required format
Validate
Clear
Easily copy and paste date and price series from excel as shown below:
See chart and basic info above.
Click save below if everything looks good!
SAVE
Clients is only available to Lite and Premium Users.
Check out our subscription options here
What is the Clients Section about?
> Easily add your client data and portfolios
> Connect your RTA files to view and analyse the latest portfolios of all your live clients
> Get a birds eye view of your business from the client dashboard
> Run full strength portfolio analytics
> Run contribution, correlations, rolling return, rolling vol, scenario and beta analysis on portfolios
> Print portfolio PDF reports
> Send interactive live portfolio share links to clients
Create your client portfolios and instantly run portfolio analytics
Manual Data - Instant
Manage your client data youself. Manually add client details and holdings to create and maintain your own client portfolios.
Here is a short video on how to add a client.
To learn more about portfolio analytics, visit our Video Archive.
RTA CONNECTION - Synced overnight - only available to PREMIUM logins
Write to support@ngenresearch.com to get connected!
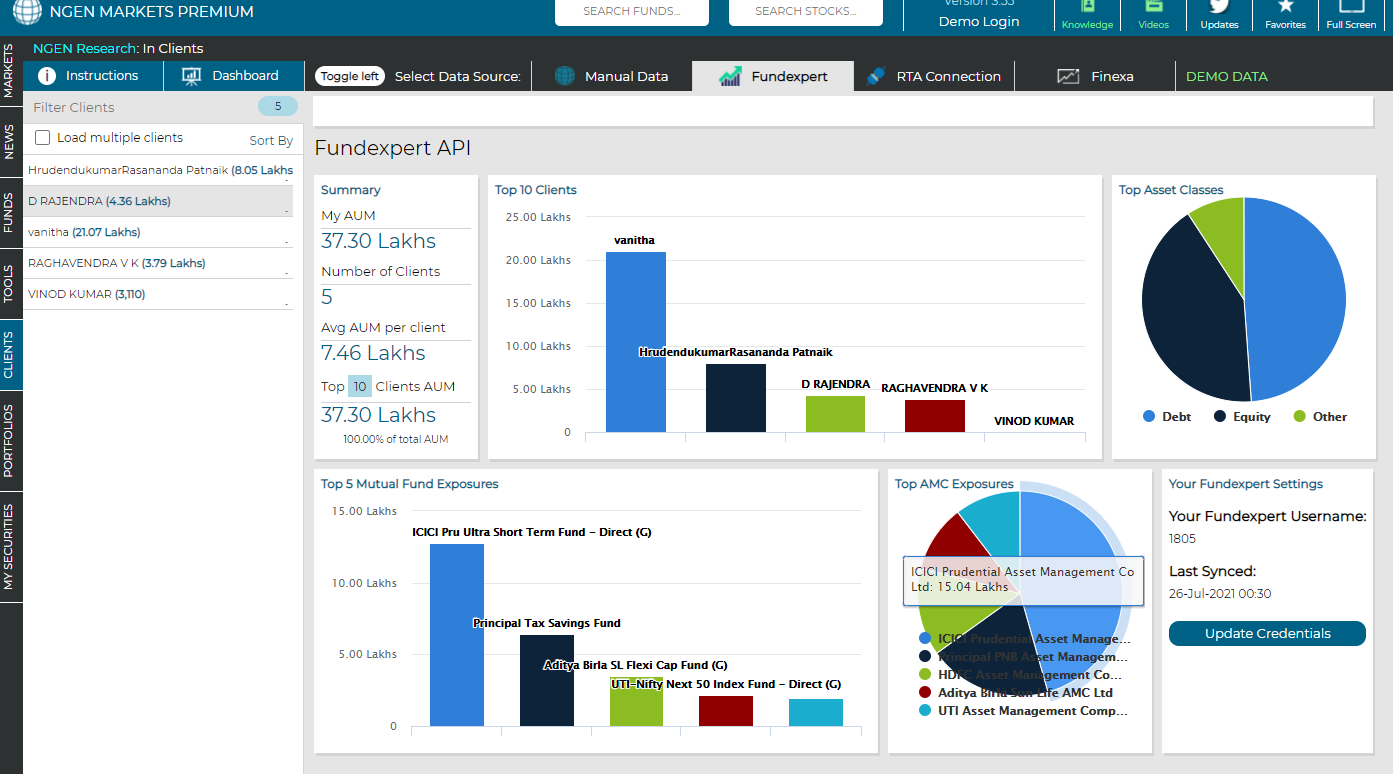
FUND EXPERT API - Synced overnight - only available to PREMIUM logins
Sign up with Fundexpert for a back office service and see all your client data synced everyday.
We have preferential rates for Fundexpert Back Office of Rs. 10,000 per annum - You can pay by clicking here.
Once you have completed payment, Fundexpert will have your data connected within 2-3 days.
OK, got it
i
Instructions
Dashboard
Toggle left
Select Data Source:
RTA Connection
Manual Data
Fundexpert
DEMO DATA
You do not have access to view RTA data. Please contact the administrator in your organisation or write to support@ngenresearch.com
Load multiple clients
Sort By
AUM Descending
AUM Ascending
Name A -> Z
Name Z -> A
Done
Client Details
Clear All
Full Name:
PAN Number:
Email:
City:
Address Line 1:
Address Line 2:
Address Line 3:
Pincode:
ADD CLIENT
Next step: Add holdings
Client Holdings
Type
Name
Last Price
As of
Units/Shares
Current Value
Add Single Client
Add Manually
Add using ISINs
Add from Statement Analyser
Add NJ Format
Bulk Upload (NGEN Format)
You have access to:
Current ARN View:
NGEN Markets has a daily-synced integration with Fundexpert backoffice.
This integration enables you to view the latest holdings of all your clients and run portfolio analytics at the click of a button.
If you are already a Fundexpert user, Click here to dismiss this message and enter your credentials.
If not, NGEN Research has arranged preferential pricing for our Premium users to buy Fundexpert backoffice at Rs. 10,000 per annum.
To purchase Fundexpert, click here
Important Information
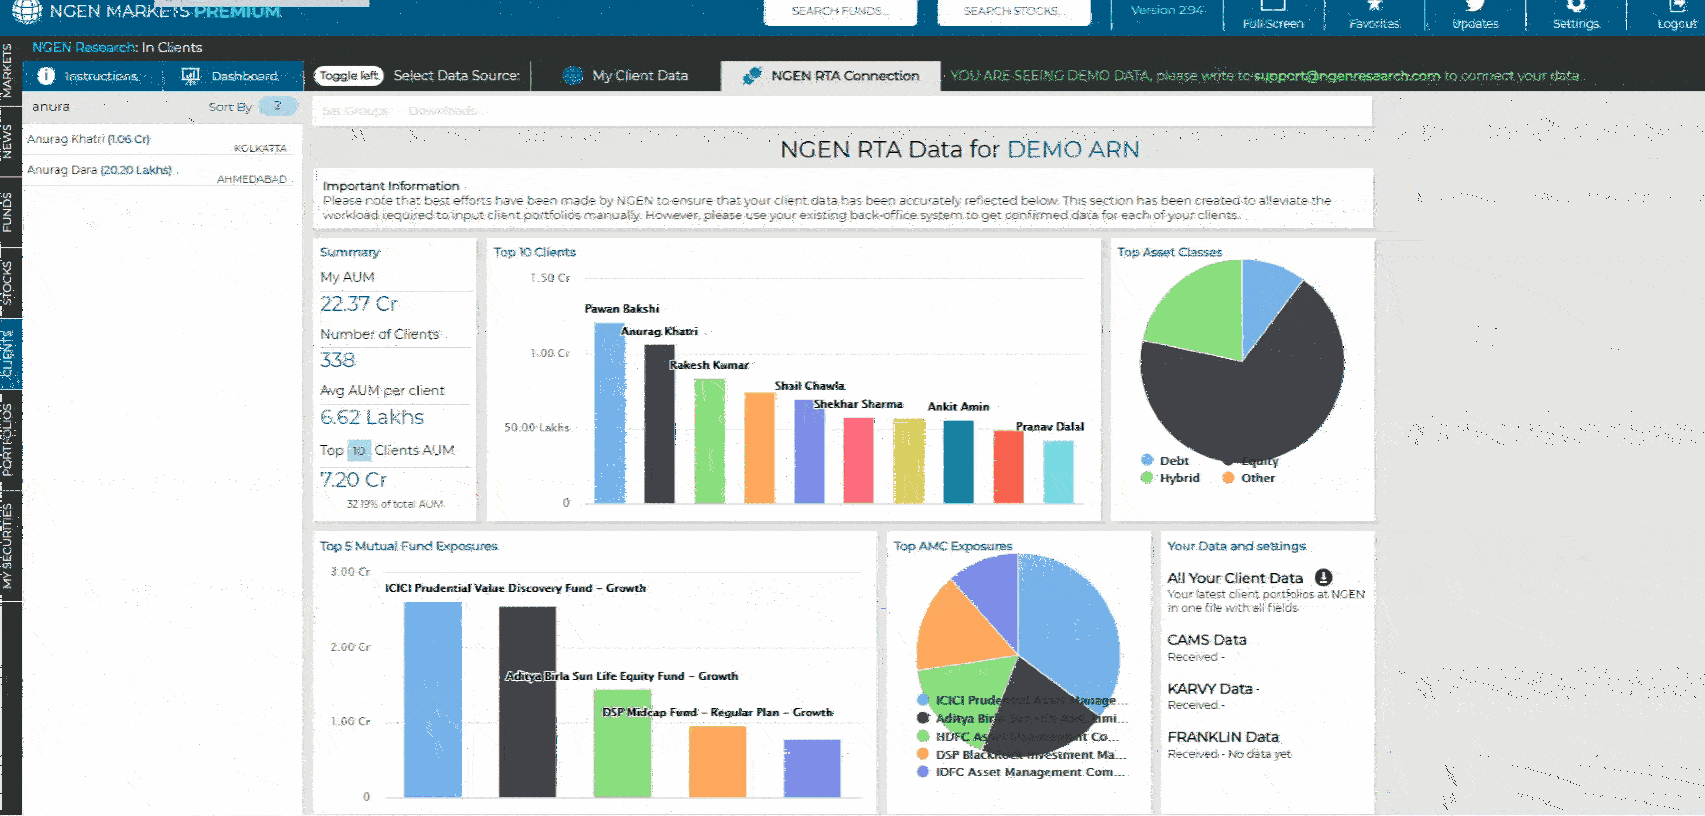
SUMMARY
My AUM
-
Number of Clients
-
Avg AUM per client
-
Top Clients AUM
-
-
Please select an individual ARN view for this search feature
CLIENT HOLDING SEARCH
You can search through all holdings across all your clients using the input provided above.
You can search using a Security Name or an ISIN Code
CLIENT
AUM
Holding
Holding %
TOP 5 MUTUAL FUND EXPOSURES (Click to drill down)
TOP ASSET CLASSES
TOP AMC EXPOSURES
YOUR DATA AND SETTINGS
All Your Client Data
Your latest client portfolios at NGEN in one file with all fields


 Market Wrap?

 Download this table


 Manual Data